

Embedding is available to all Lightdash Cloud users and Enterprise On-Prem customers. Get in touch to have this feature enabled in your account.
Overview
Chart embedding displays a single saved chart with a minimal, focused interface — a clean, distraction-free view of one visualization, scoped to that chart alone.When to use chart embedding
- Single KPI displays: show one key metric or visualization
- Embedded widgets: add analytics widgets to application pages
- Minimal UI: a clean, focused display with no dashboard chrome
- Scoped access: grant access to specific charts, not entire dashboards
How it differs from dashboard embedding
Chart embeds support all chart types (bar, line, pie, table, big number, and so on), parameterized charts with their saved values, and — when enabled in the JWT — CSV export, image export, and viewing underlying data.
Set up a chart embed
Follow the embedding quickstart for the shared setup: create an embed secret and generate tokens from your backend. The chart-specific part is the allowlist — each chart must be added individually under Settings → Embed before it can be embedded.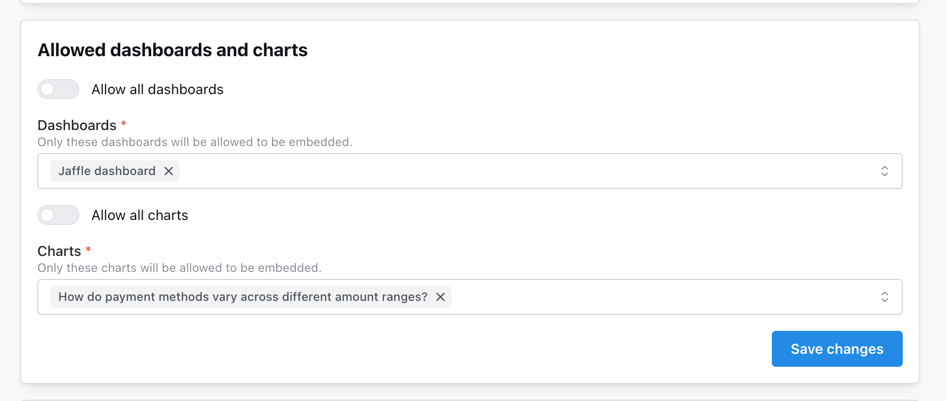
Embed with the React SDK
Render a chart withLightdash.Chart, passing the chart UUID and a server-generated token:
Configure what viewers can do
A chart token is scoped to one chart viacontent.contentId (the saved chart UUID). Inside content, you can allow CSV export, image export, and viewing underlying data. For the full schema, see the chart token in the embedding reference.
Parameter values are fixed when the chart is saved. A chart embed displays the chart with its saved parameter configuration.
Limitations
Chart embeds are always read-only and single-scope. Compared to dashboard embeds, viewers cannot modify dimensions, metrics, or visualization type; add or change filters (including via the SDKfilters prop); reach the Explore view or underlying data model; or access any content beyond the chart named in contentId.
If you need interactive filters or exploration, use dashboard embedding instead, or reach out with your use case.
Example: single KPI widget
Drop a key metric into your own layout and let the chart background go transparent so it inherits your styling:user metadata in the token to attribute queries in usage analytics, and userAttributes for row-level security. Styling and localization props are covered in the React SDK reference.
Next steps
Embedding reference
Complete chart JWT structure and options
React SDK reference
Props, styling, and localization for the Chart component
Embedding dashboards
Embed multiple charts with filters and interactivity
User attributes & row-level security
Show different data to different users