> ## Documentation Index
> Fetch the complete documentation index at: https://lightdash-refactor-full-audit-reorg.mintlify.site/llms.txt
> Use this file to discover all available pages before exploring further.
# How to Embed Dashboards
> Embed a full Lightdash dashboard — with filters, exports, and interactive tiles — using an iframe or the React SDK.
Embedding is available to all Lightdash Cloud users and Enterprise On-Prem customers. [Get in touch](https://lightdash.typeform.com/to/BujU5wg5) to have this feature enabled in your account.
## Overview
Dashboard embedding displays a full Lightdash dashboard in your application — multiple visualizations, filters, tabs, and interactive features — so you can give users comprehensive analytics views without a Lightdash login. It's the only surface you can embed with a plain iframe; everything else needs the [React SDK](/embed/react-sdk).
### When to use dashboard embedding
* **Executive dashboards**: multiple KPIs and metrics in admin panels
* **Customer-facing analytics**: analytics portals for SaaS customers
* **Embedded reporting**: comprehensive data views inside your workflows
* **Multi-chart views**: related visualizations with shared filters
### What you can put on an embedded dashboard
An embedded dashboard renders the same tiles it does in Lightdash: saved charts, SQL Runner charts, [data app](/data-apps) tiles, and markdown, Loom, and heading tiles, organized across multiple tabs.
SQL Runner chart tiles are authorized through dashboard-tile membership, so they render with existing embed JWTs — you don't need to regenerate tokens or change embed URLs. A SQL chart is only embeddable as part of a dashboard; a chart-scoped JWT (`type: 'chart'`) can't embed one on its own.
## Set up a dashboard embed
Embedding always starts with the shared setup: create an embed secret, add your dashboard to the allowlist, preview it, and generate tokens from your backend. Follow the [embedding quickstart](/embed/set-up-embedding) for those steps.
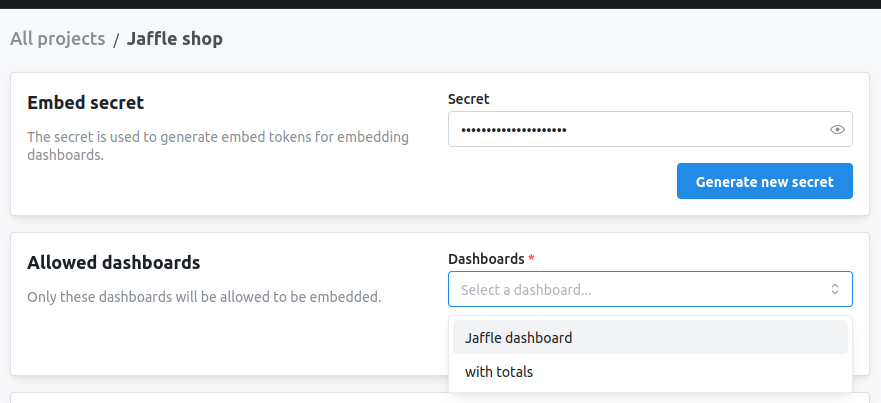
The only dashboard-specific part of setup is the allowlist: only dashboards added to the **allowed dashboards** list can be embedded. Add yours under **Settings → Embed**, or toggle **Allow all dashboards** to embed any dashboard in the project.
 ## Configure what viewers can do
Everything a viewer can do on an embedded dashboard is controlled by fields nested inside the JWT `content` object: interactive dashboard filters (including letting viewers add their own), parameters, CSV/image/PDF exports, date zoom, "Explore from here", viewing underlying data, and rendering data app tiles. Adding a `writeActions` claim also lets viewers save charts from Explore or edit and build dashboards through the SDK.
Interactivity options like `dashboardFiltersInteractivity`, `canExportCsv`, and `canExplore` must live **inside `content`**, not at the top level of the payload. At the root level they're silently ignored.
For the full list of options, their accepted values, and per-option UI screenshots, see the [dashboard token](/embed/reference#dashboard-token) and [interactivity options](/embed/reference#interactivity-options-reference) in the embedding reference. A token that exercises the common ones looks like this:
```javascript theme={null}
import jwt from 'jsonwebtoken';
const token = jwt.sign({
content: {
type: 'dashboard',
projectUuid: 'your-project-uuid',
dashboardUuid: 'your-dashboard-uuid',
// Filters and parameters
dashboardFiltersInteractivity: { enabled: 'all' },
parameterInteractivity: { enabled: true },
// Exports
canExportCsv: true,
canExportImages: true,
canExportPagePdf: true,
// Interactive features
canDateZoom: true,
canExplore: true,
canViewUnderlyingData: true,
canViewDataApps: true,
},
// Analytics (optional)
user: {
externalId: 'user-123',
email: 'user@example.com',
},
// Row-level filtering (optional)
userAttributes: {
tenant_id: 'tenant-abc',
},
}, LIGHTDASH_EMBED_SECRET, { expiresIn: '1h' });
```
**Required filters behave the same as in the app.** Embedded dashboards honor [required filters and requirement groups](/explore/filter-your-data#required-filters-and-filter-requirement-groups): tiles stay locked and don't load data while any rule is unmet, and viewers see the guided setup card. Style it with the [`ld-dashboard-guided-setup`](/embed/react-sdk#css-class-overrides) class.
### Let viewers save and edit content
Add a `writeActions` claim to let embedded users save a new chart from Explore, or — through the React SDK — edit an existing dashboard or build a new one. Lightdash performs the write as a configured actor (a service account or user) into a fixed destination space. See [Write actions](/embed/reference#write-actions) for the claim and [`Lightdash.Dashboard` edit mode](/embed/react-sdk#with-edit-mode) for the SDK flow.
Newly saved charts aren't added to the embed allowlist, so they won't be re-embeddable unless you add them explicitly.
### View data apps
[Data app](/data-apps) tiles run their own metric queries, so they only render when the JWT sets `canViewDataApps: true`. When it's off (the default), the tile shows a placeholder and no queries run. When on, the data app inherits the embed's user attributes and filters, so row-level access still applies — only enable it for audiences you trust with the data the app can query. For standalone data app embedding (no dashboard), see [How to embed data apps](/embed/embed-data-apps).
## Embed with an iframe
iframe embedding needs no libraries or CORS. Pass the project UUID in the path and the JWT in the hash fragment; the dashboard is identified by `content.dashboardUuid` inside the token, not the URL:
```
https://your-instance.lightdash.cloud/embed/{projectUuid}#{jwtToken}
```
```html theme={null}
```
The [iframe embedding reference](/embed/iframe) covers URL parameters (including `theme`, `backgroundColor`, and `timezone`), responsive and dynamic sizing, token refresh, and troubleshooting.
## Embed with the React SDK
The React SDK renders the dashboard as a component and adds programmatic filters, callbacks, custom styling, and edit mode.
```tsx theme={null}
import Lightdash from '@lightdash/sdk';
function MyDashboard() {
return (
);
}
```
See the [React SDK reference](/embed/react-sdk#lightdashdashboard) for installation, CORS setup, props, filters, theming, and localization.
## Next steps
Complete JWT structure and every interactivity option
URL patterns, theming, sizing, and token refresh
Props, programmatic filters, styling, and edit mode
Show different data to different users
## Configure what viewers can do
Everything a viewer can do on an embedded dashboard is controlled by fields nested inside the JWT `content` object: interactive dashboard filters (including letting viewers add their own), parameters, CSV/image/PDF exports, date zoom, "Explore from here", viewing underlying data, and rendering data app tiles. Adding a `writeActions` claim also lets viewers save charts from Explore or edit and build dashboards through the SDK.
Interactivity options like `dashboardFiltersInteractivity`, `canExportCsv`, and `canExplore` must live **inside `content`**, not at the top level of the payload. At the root level they're silently ignored.
For the full list of options, their accepted values, and per-option UI screenshots, see the [dashboard token](/embed/reference#dashboard-token) and [interactivity options](/embed/reference#interactivity-options-reference) in the embedding reference. A token that exercises the common ones looks like this:
```javascript theme={null}
import jwt from 'jsonwebtoken';
const token = jwt.sign({
content: {
type: 'dashboard',
projectUuid: 'your-project-uuid',
dashboardUuid: 'your-dashboard-uuid',
// Filters and parameters
dashboardFiltersInteractivity: { enabled: 'all' },
parameterInteractivity: { enabled: true },
// Exports
canExportCsv: true,
canExportImages: true,
canExportPagePdf: true,
// Interactive features
canDateZoom: true,
canExplore: true,
canViewUnderlyingData: true,
canViewDataApps: true,
},
// Analytics (optional)
user: {
externalId: 'user-123',
email: 'user@example.com',
},
// Row-level filtering (optional)
userAttributes: {
tenant_id: 'tenant-abc',
},
}, LIGHTDASH_EMBED_SECRET, { expiresIn: '1h' });
```
**Required filters behave the same as in the app.** Embedded dashboards honor [required filters and requirement groups](/explore/filter-your-data#required-filters-and-filter-requirement-groups): tiles stay locked and don't load data while any rule is unmet, and viewers see the guided setup card. Style it with the [`ld-dashboard-guided-setup`](/embed/react-sdk#css-class-overrides) class.
### Let viewers save and edit content
Add a `writeActions` claim to let embedded users save a new chart from Explore, or — through the React SDK — edit an existing dashboard or build a new one. Lightdash performs the write as a configured actor (a service account or user) into a fixed destination space. See [Write actions](/embed/reference#write-actions) for the claim and [`Lightdash.Dashboard` edit mode](/embed/react-sdk#with-edit-mode) for the SDK flow.
Newly saved charts aren't added to the embed allowlist, so they won't be re-embeddable unless you add them explicitly.
### View data apps
[Data app](/data-apps) tiles run their own metric queries, so they only render when the JWT sets `canViewDataApps: true`. When it's off (the default), the tile shows a placeholder and no queries run. When on, the data app inherits the embed's user attributes and filters, so row-level access still applies — only enable it for audiences you trust with the data the app can query. For standalone data app embedding (no dashboard), see [How to embed data apps](/embed/embed-data-apps).
## Embed with an iframe
iframe embedding needs no libraries or CORS. Pass the project UUID in the path and the JWT in the hash fragment; the dashboard is identified by `content.dashboardUuid` inside the token, not the URL:
```
https://your-instance.lightdash.cloud/embed/{projectUuid}#{jwtToken}
```
```html theme={null}
```
The [iframe embedding reference](/embed/iframe) covers URL parameters (including `theme`, `backgroundColor`, and `timezone`), responsive and dynamic sizing, token refresh, and troubleshooting.
## Embed with the React SDK
The React SDK renders the dashboard as a component and adds programmatic filters, callbacks, custom styling, and edit mode.
```tsx theme={null}
import Lightdash from '@lightdash/sdk';
function MyDashboard() {
return (
);
}
```
See the [React SDK reference](/embed/react-sdk#lightdashdashboard) for installation, CORS setup, props, filters, theming, and localization.
## Next steps
Complete JWT structure and every interactivity option
URL patterns, theming, sizing, and token refresh
Props, programmatic filters, styling, and edit mode
Show different data to different users